By the end of this guide you will have a status page at your own address, one component on it, a monitor checking the real thing, and a rule that changes the component when the check fails. Nothing here needs a paid plan.
What you need
- An email address for the account.
- A public URL to monitor. A marketing site, an API health endpoint, anything that answers HTTPS.
- About ten minutes.
1. Create the account
Sign up with an email address and a password. Confirm the address from the email we send, then sign in. The first sign-in creates your organisation and a default workspace named after it; you can rename both later.
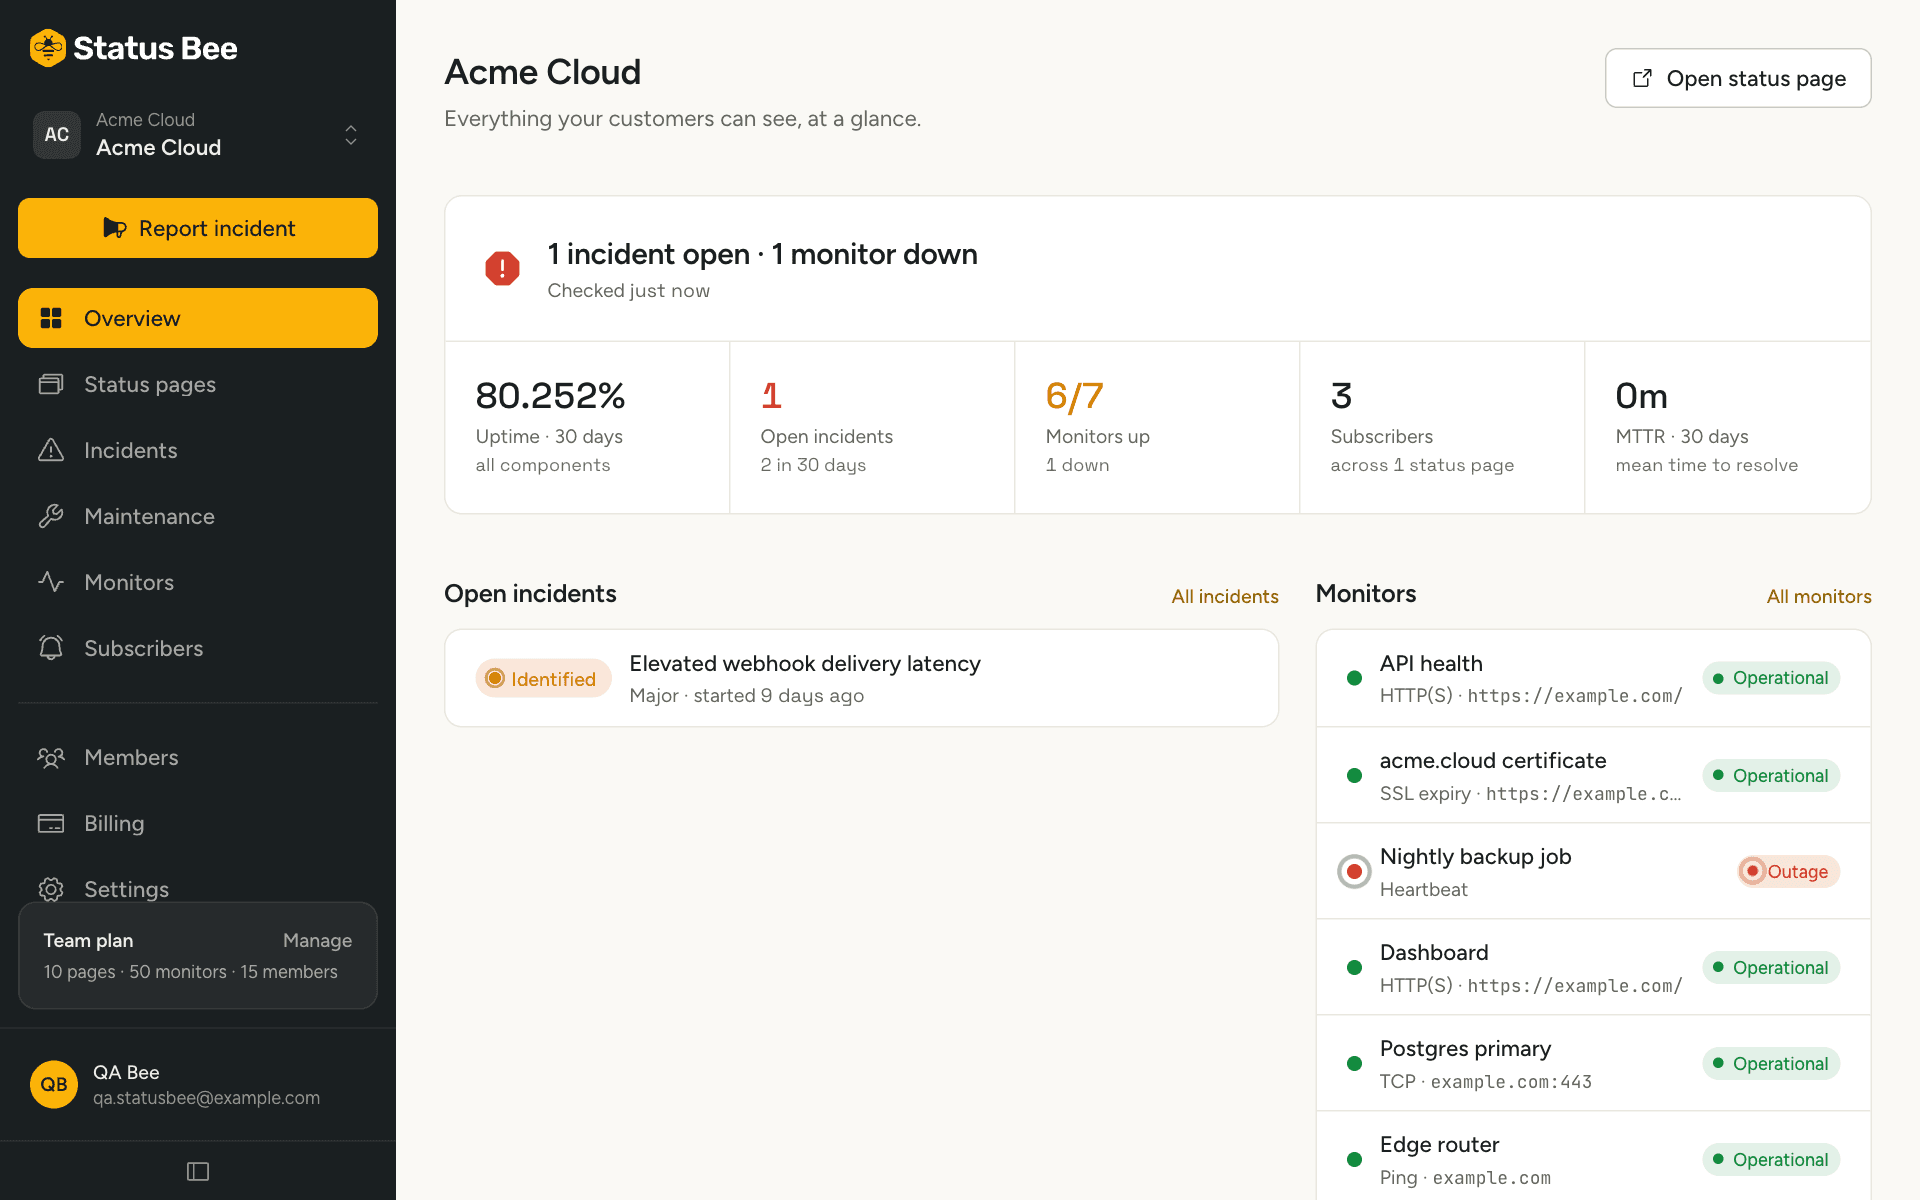
You land on the Overview: an empty one for now.
2. Publish a page
- Open Status pages and choose New page
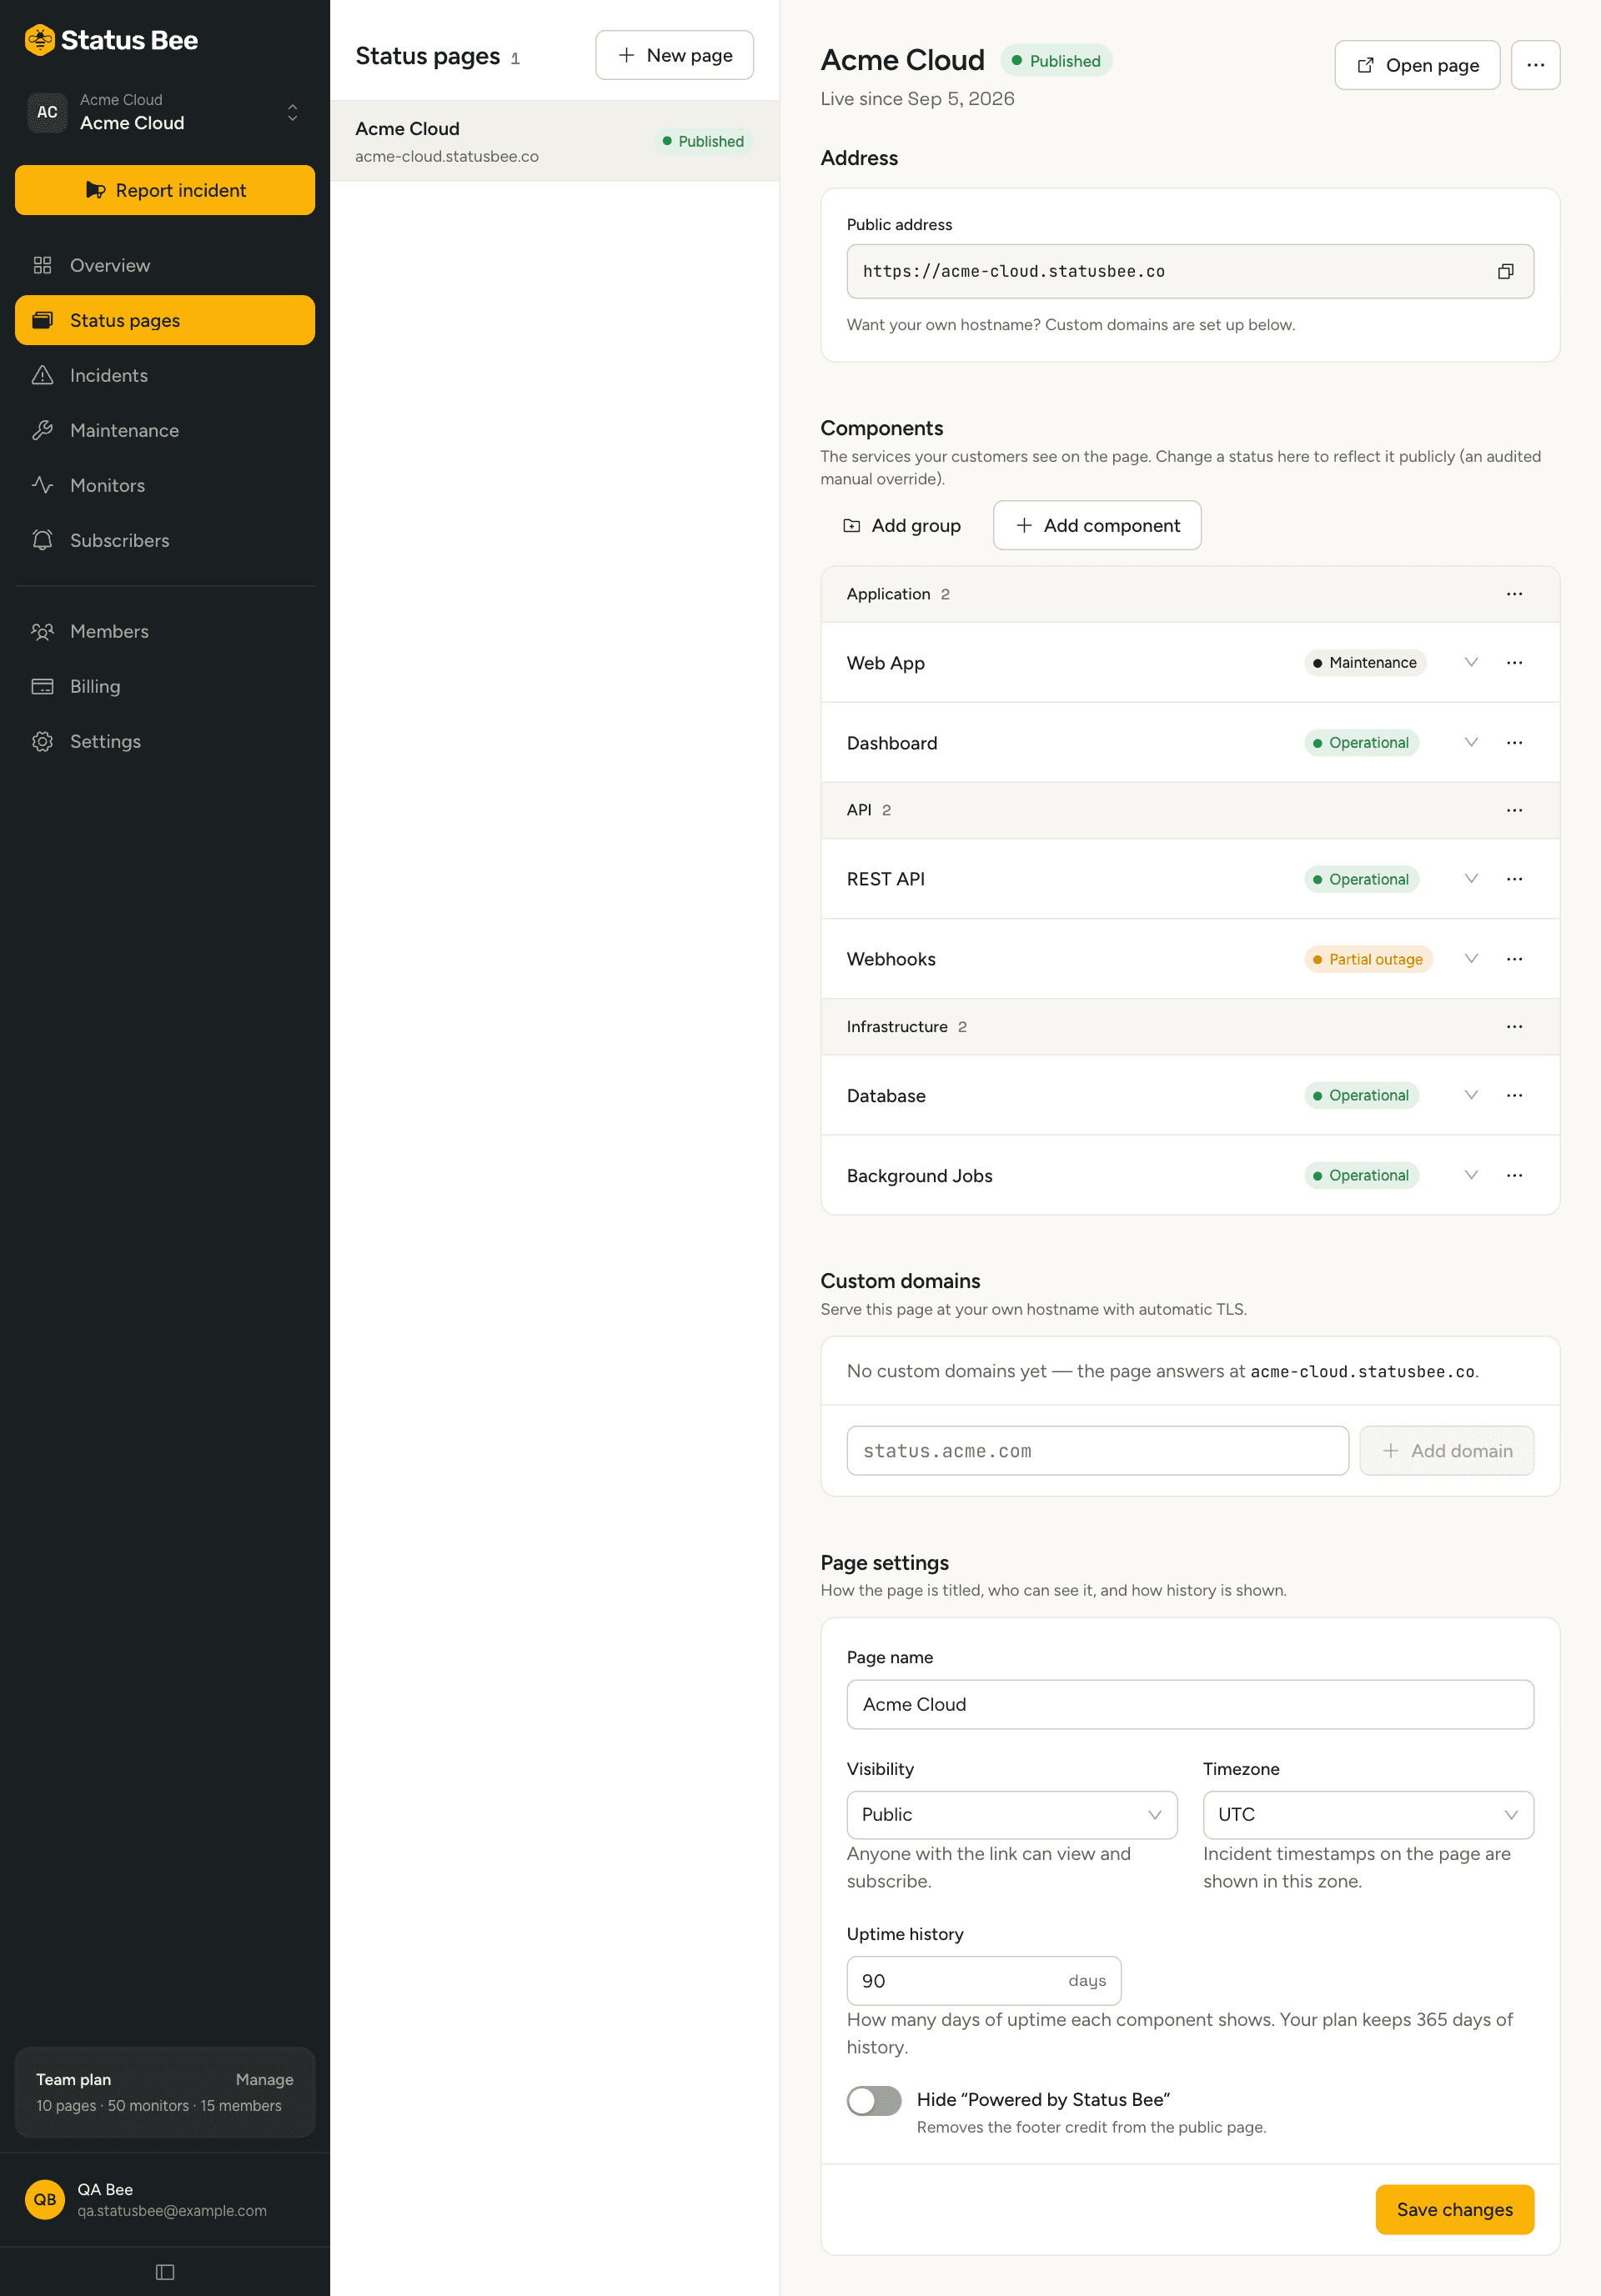
Give it a name customers will recognise, usually your product's name. The address is derived from it:
acme-cloud.statusbee.co. - Pick a template
SaaS, API, agency or blank. Templates add component groups and components you can rename or delete in a minute; picking one is faster than starting empty.
- Publish
The page goes live at its address straight away. It shows every component as Operational until you or a monitor says otherwise.
3. Name the components
Components are the rows customers see. Rename the template's components to the words your customers use: “Checkout” rather than “payments-svc”. Delete what does not apply. Two to six components is typical for a small product.
Each component has a status you can set by hand from its row. Leave them Operational; the monitor will take it from here.
4. Add a monitor
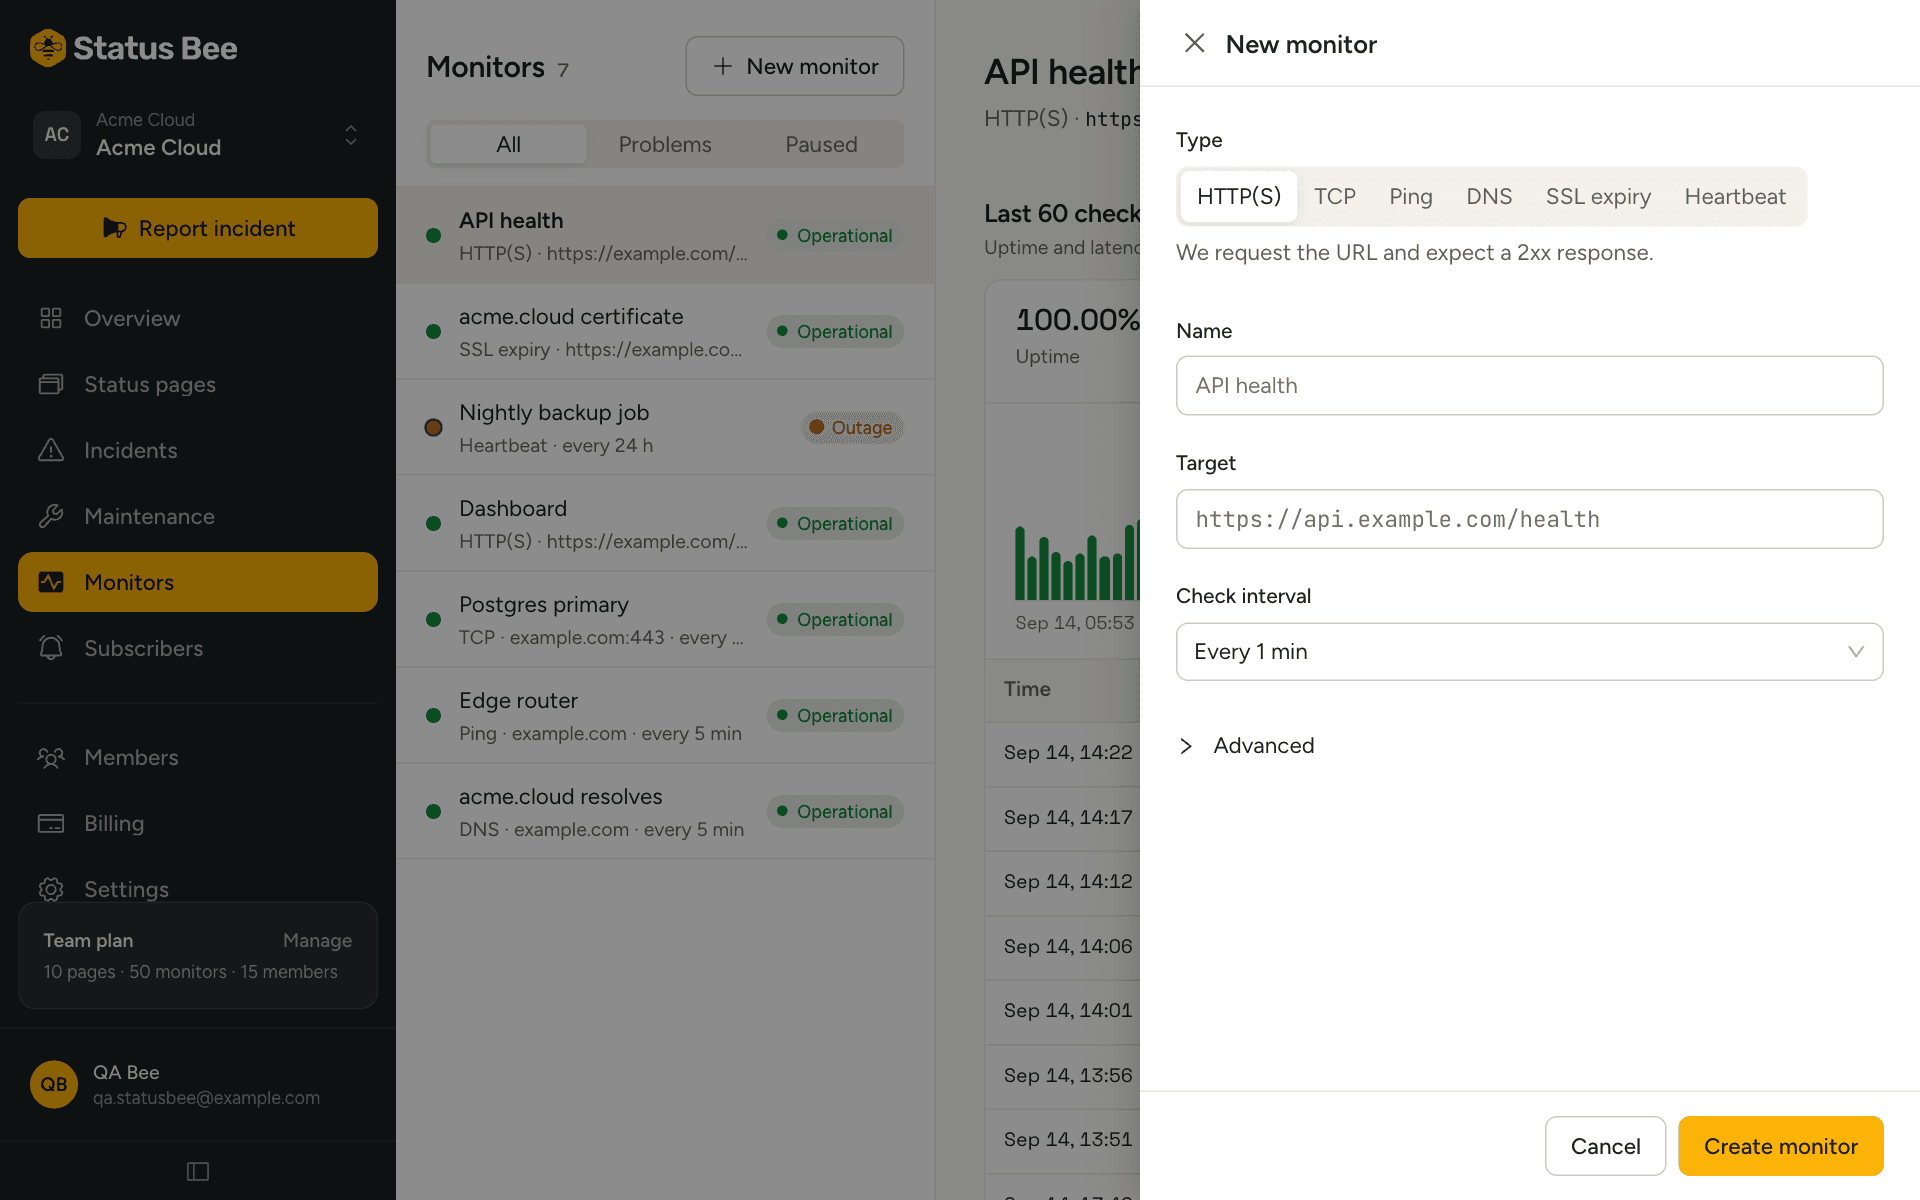
- Open Monitors and choose New monitor
Leave the type on HTTP(S). Name it, paste the URL, and pick an interval. Every 5 minutes is the floor on Free; paid plans go down to every minute or every 30 seconds.
- Create it
The first check runs within a few seconds. The monitor shows Pending until it has a result, then Operational.
5. Link the monitor to a component
Open the monitor and find Rules. Add a rule that points at the component you want it to control. The defaults are the sensible ones: on failure set the component to Outage and draft an incident for you to review; on recovery set it back to Operational.
That is the whole loop. A failing check now changes the page, and a drafted incident waits for you in Incidents so you can add words and publish.
6. Tell people about it
- Put the page's link in your app footer and your support signature. That is where customers look first.
- Connect the team alert channel under Settings, Webhooks, or subscribe your own Slack channel from the page itself, so you hear about incidents where you already are.
- Subscribe with your own email to see what customers receive.